Processed Samples
250
Self-annotated in CVAT before training.
Microscopy Image Analysis
A microscopy detection pipeline that counts pico-algae cells from paired brightfield and fluorescence image channels.
This repository implements an end-to-end deep learning workflow for detecting and counting pico-algae in microscopy imagery. The core model is a custom 6-channel Faster R-CNN that fuses paired microscope images, then supports training, hyperparameter tuning, post-processing sweeps, and batch visualization of predicted bounding boxes.
The project is built around dense small-object detection, where manual counting is slow and subject to variability. It targets paired microscopy captures and predicts cell-level boxes for four foreground classes: `Eukaryote`, `Phycoerythrin`, `Phycocyanin`, and `Colony`.
The repository includes data preparation scripts, manifest generation, image resizing to a fixed 2048x1500 format, annotation sanity checks, training and inference entrypoints. The dataset was self-annotated in CVAT before being converted into the training format used by the detector.
The modeling work goes beyond a default detector setup. The Faster R-CNN backbone is patched from 3 input channels to 6 so the network can ingest both image channels together, and the repo includes separate sweeps for model settings and post-processing thresholds.
Saved outputs show that the project is not only a training prototype but also an analysis workflow: example detections, debug overlays, EDA plots, and tuning CSVs are all present in the repository.
Manual pico-algae counting in microscopy images is slow and error-prone.
Cells are small, dense, and sometimes overlapping, which makes classical counting brittle.
The workflow needs to use paired differently painted microscopy images rather than a single RGB frame.
Counting quality depends not only on training but also on score thresholds and NMS settings in crowded scenes.
Built the training and batch inference workflow around a Faster R-CNN detector in PyTorch.
Adapted a ResNet50-FPN Faster R-CNN backbone from 3-channel input to a 6-channel fusion model for paired microscopy images.
Implemented dataset indexing, pair discovery, preprocessing, self-annotation workflow in CVAT, annotation conversion, and visualization utilities.
Added evaluation code focused on count-based metrics and ran separate tuning sweeps for model settings and post-processing.
Preprocessed raw microscopy pairs into a consistent 2048x1500 WEBP dataset and rescaled bounding boxes into absolute-pixel labels.
Annotated the dataset in CVAT and converted those labels into the detector-ready training format.
Validated dataset integrity with manifest generation and sanity checks for missing pairs, missing labels, and image-size mismatches.
Trained a 6-channel Faster R-CNN (ResNet50-FPN) initialized from COCO weights with an expanded first convolution layer.
Evaluated the detector using count-based metrics such as count MAE, RMSE, and bias, with optional class filtering.
Tuned anchor settings, backbone depth, learning rates, detection caps, score thresholds, and NMS thresholds through saved sweep configs and CSV outputs.
Finished and in use: colleagues now run this pipeline to count pico-algae in their own microscopy data.
The repository contains a complete reproducible workflow from dataset preparation to batch prediction visualizations.
The processed training index contains 250 paired image samples in a self-annotated CVAT dataset with 16,181 labeled boxes.
A saved 5-fold training sweep reached a best mean count MAE of 3.94 before post-processing optimization.
A saved 5-fold post-processing sweep reduced the best mean count MAE to 2.42 with a standard deviation of 0.50.
Example outputs, EDA plots, debug overlays, and batch prediction renders are all included as inspectable artifacts.
Processed Samples
250
Self-annotated in CVAT before training.
Labeled Boxes
16,181
Best Count MAE
2.42
Foreground Classes
4
Eukaryote, Phycoerythrin, Phycocyanin, Colony.
Outputs and diagrams from the project.
Pipeline diagram for the pico-algae workflow.
Additional pico-algae detection output.
Additional pico-algae detection output.
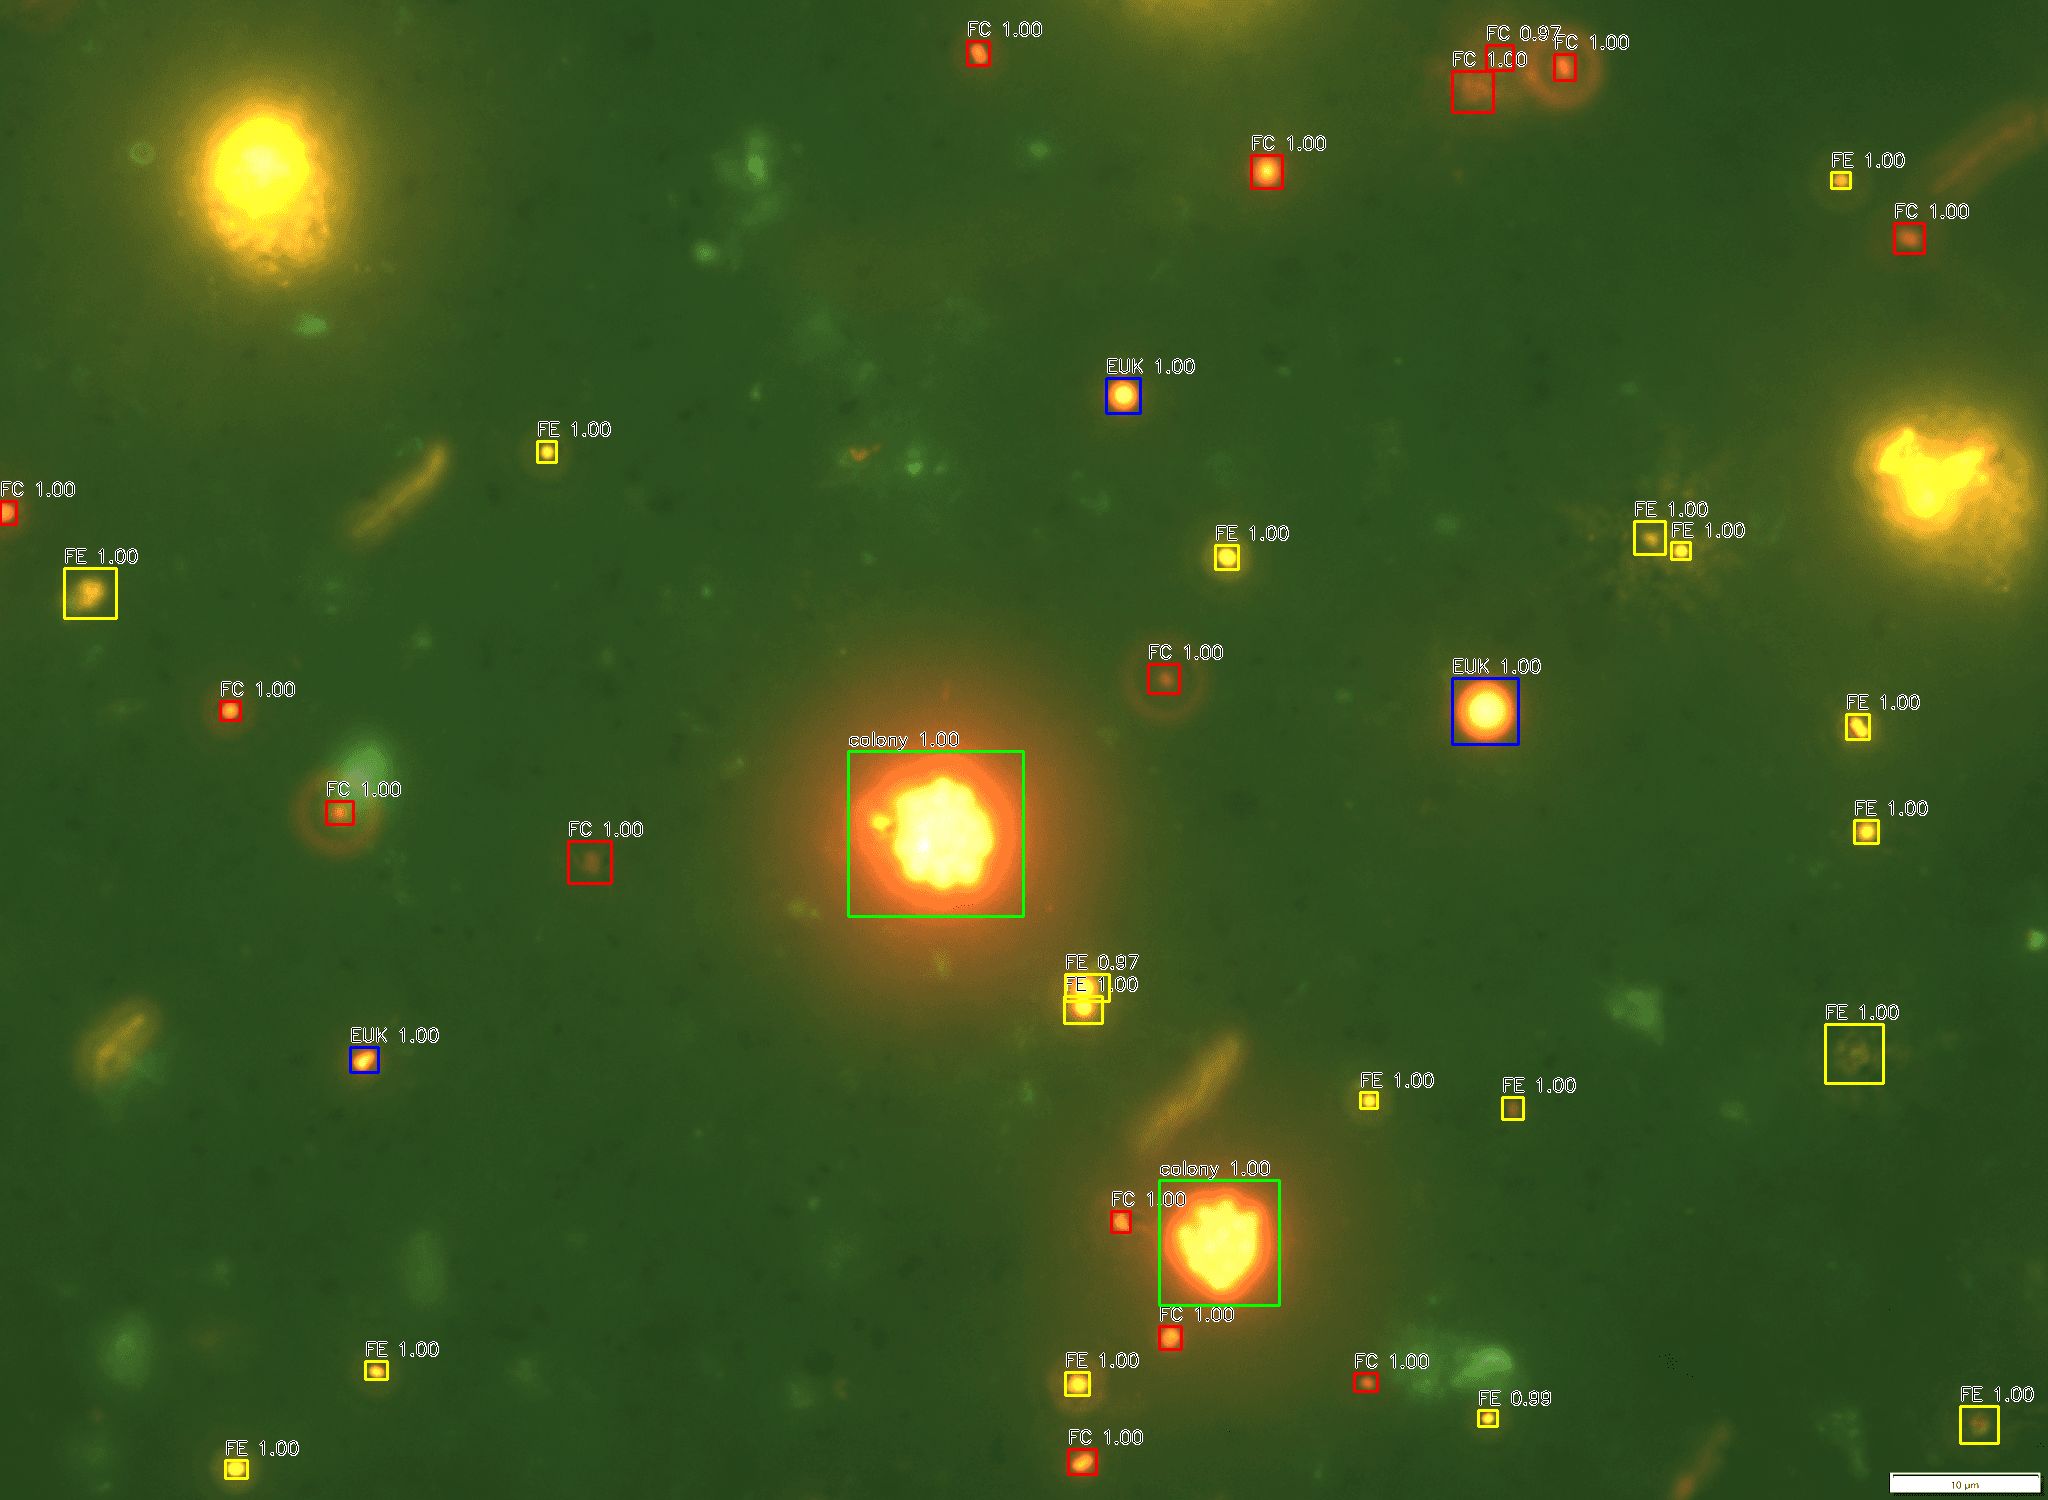
Predicted detections on a microscopy sample.
Saved figures and chart artifacts referenced by the project.
Object count distribution per image.
Bounding-box width distribution.
Bounding-box height distribution.
Distribution of labeled bounding boxes across the four foreground classes in the training dataset.
Compares the best saved result from model-configuration tuning against the best saved post-processing sweep.